We asked our resident data geek for her favorite free data visualization tools. These tools are becoming more and more important to understand how PR and social campaigns are performing, uncover opportunities for improvement, and as always, prove to executives that PR works.
As businesses and organizations have become more focused on data, the importance of tracking, measuring, and analyzing every interaction has moved to the forefront. This has allowed users to glean more from their daily transactions; however, an overabundance of data can be a liability if it isn’t harnessed or utilized correctly.
In response, the market has been flooded with data visualization software and tools. These tools allow organizations to illustrate ideas and data as well as share significant analytics with shareholders, customers, and the broader global community.
Data visualization is an integral part of any analytics strategy, and there are many powerful tools with wide-ranging capabilities in how they visualize and direct data. To cut through the clutter, I’ve assembled a list of free and easy-to-use data visualization tools that will help transform your data.
5 of the Best Data Visualization Tools
Open Refine is a free open-source tool that helps you easily explore large data sets, clean and transform data, and reconcile and match data. Transforming data is typically a painstaking process, so if you find yourself with messy, mismatched data in need of some assistance, check out Open Refine.
Charted is a tool that aims to transform your data into visualization in as few steps as possible. It automatically creates data visualizations by using linked files and turning them into sleek, shareable charts. Focusing purely on visualizations, Charted is perfect for datasets that look good in simple line or stacked column charts. While Charted does not store or manipulate any data, it does refresh every 30 minutes so your charts are always up-to-date.
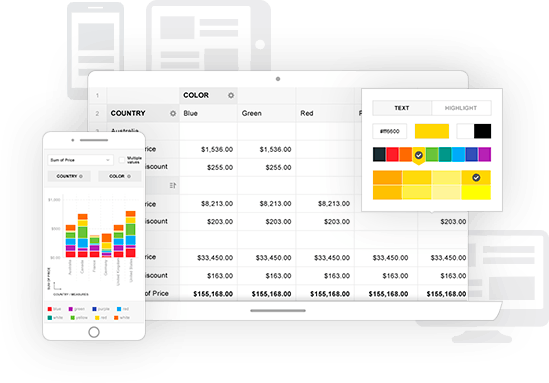
WebDataRocks is a web pivot table that provides data analysis and visualization by integrating and analyzing complex data. Wrapped in a modern UI, the pivot table quickly aggregates data and shows real time insights. After uploading a CSV or JSON file, users can instantly see, understand, and interact with their data thanks to user-friendly drag and drop fields, sorting, and filtering.

Information is Beautiful is a curated library of pre-built visualizations. The visualizations, based on facts and data, are constantly updated, revised, and rotated to reflect accuracy and the current climate. Information is Beautiful’s mission is to help the public make more informed decisions and as a result, everything is downloadable. These visualizations are an easy way to add striking and informative visuals to in-house presentations. Make sure to check out their licensing agreements though, because while they give free access to individuals, they do charge for commercial uses.
Google Charts is an easy-to-use online application that enables users to visually display data on their website. Using a simple JavaScript embedded on the web page, users have complete control over the look and feel of their data. Charts are highly customizable and can be anywhere from simple plots to exceedingly hierarchical treemaps—they can even be bolstered with interactive elements such as animations. There’s an extensive library of examples to gain inspiration, so it’s exceedingly easy to get started.
BONUS: Data Visualization Designed for PR and Comms Professionals

Of course, here at Meltwater, we’ve been busy with some data visualization of our own. Our current favorite is the Meltwater Insight Reports Builder within the Meltwater Suite which enables comms pros to crate slick reports in just a few clicks based on brand and competitor searches. Looking to streamline your reporting, visualizations, and competitive intelligence?
We can help.