

Your social media strategy doesn’t end with posting content and watching the likes and shares roll in. At some point, you need to step back from your campaigns and see how well you’re performing. That’s where social media reporting comes into play.
Social media analytics tools, like Meltwater, track your engagement, activities, and other metrics and compile them into a presentation-ready, easy-to-understand report. From there, you can answer deeper-level questions about your performance, make decisions on how to improve, and illustrate how social media is working for your business goals.
Here’s an all-in-one guide on how to use social media reporting in your strategy. Feel free to download the ultimate guide to social media reporting and use our social media report template below to start using our reporting tips!
Table of Contents
What is Social Media Reporting?
Why is Social Media Reporting Important?
What Metrics Should You Include in Your Social Media Report?
How to Use a Template for Your Social Media Reporting (with Sample Template Included)
Download Our Social Media Reporting Template
What is Social Media Reporting?


Social media reporting is defined as using analytics to create reports regarding your social media campaigns and activity. Here's a quick overview of some of the data or figures a social report can include:
- Audience size
- Number of new followers
- Number of lost followers
- Metrics for specific campaigns
- Engagement metrics like shares, likes, retweets, etc.
- Number of people reached
- Post clicks
- Number of video views
- Most popular content
The actual items in your report may vary by social channels or third-party tools. Each platform has its own set of built-in analytics that track activity on your behalf. You can run reports in each of your social platforms to see which platform is the most valuable to your social strategy.
But, if you want to save time and not have to run reports on each social media platform separately, you should consider using a social media management platform like the Meltwater Social Media Management Suite.
Why is Social Media Reporting Important?
Let’s say you share your latest blog post on your Facebook page. You notice it gets a few likes and shares. Now, let’s say you share another blog the next week and it gets even more likes and shares than the first one. Why is the second one your top-performing post?
Is it because more people saw the second post? Did you gain some new followers since last week? Was it a more intriguing blog title?
The best way to answer these and other questions is to run a social media report on your key social media metrics.
Social media reports collect and compile the data behind your efforts. Reports can give you quantitative insights, such as the number of mentions, engagement rate, and audience size. They can also give you qualitative data, such as your most popular content, brand sentiment analysis, and what people are saying.
Reports are the difference between knowing with confidence how your campaigns and marketing strategy are performing versus going on a hunch.
If you’re an agency, your clients want to see what you’re accomplishing on their behalf. You can present clients with a social media metrics report and show them how you’re helping them achieve their goals.
Or if you’re working on a team, reports can show your boss exactly what you’re doing on the company's social media channels. You can analyze reports to see where you’re doing well and where you can improve.
With up-to-date social media data in hand, you can make better use of your time, budget, and energy and leave much of the guesswork behind.
Tip: A social media report may also help you answer questions like, "What is the best time to post on social media?" or "How is cross-posting impacting my social engagement?".
What Metrics Should You Include in Your Social Media Report?
Before you can start leveraging social reporting, you first need to consider which metrics you want to measure. Social media managers don’t create reports because they look nice – it’s what’s in those reports that matter most.
That said, there isn’t a single set of metrics that work for every brand and every social platform.
Let’s look at some things to consider that will influence your metrics and report content:
- What are the use-cases of the report? You might want to measure the in-depth performance of a specific campaign, high-level engagement on Facebook, or how many new followers you get on Instagram. You might want to look at real-time data or short-term or long-term gains. Focus on metrics that support your goals so that non-essential details don’t get in the way.
- What time period are you covering? Reports are timely. You can generate a weekly report, quarterly report, or look at progress month-over-month. Or, you might want a longer report that covers your all-time stats, starting from when you first opened your social media account.
- Who is the report for? Just like creating content for your target audience, your social reports should be tailored to the person who needs to know what you’re sharing. If it’s your marketing manager, they’re likely familiar with the metrics and analytics terms. If it’s for a boss who doesn’t spend much time with social media marketing, you may need to spell out the role and importance of certain metrics.
- What do you need to measure? Circle back to the goal of the report and think about the quantitative and qualitative metrics that support your goal. For example, if you’re running a campaign to increase sales, then you might look at sign-ups, audience growth, post reach, and click-through rates. On the other hand, if your goal is to get new email subscribers, looking at new followers wouldn’t be relevant.
Once you know what metrics and KPIs to measure, you can start creating your social media report.
Let’s look at social media reporting through the lens of each platform’s analytics:
Facebook Page Insights and Audience Insights
Facebook offers two types of analytics: Page Insights and Audience Insights.
Facebook Page Insights offer engagement-related metrics, such as post clicks, comments, views, post reach, and video views.
Audience Insights shares more information about your audience as well as the Facebook population at large. You can drill down into metrics like age, gender, geographic location, education, interests, and other useful data.
Both can be helpful as you’re planning your content marketing and ad campaigns. Use these reports for market research to learn more about the people you’re targeting.
Instagram Analytics
Because Facebook owns Instagram, you can track paid ads on IG through the Facebook Ads Manager. In addition, Instagram has its own set of analytics. Get insight into metrics like:
- Profile visits
- Click-through rates to a landing page or website
- Clicks on Call or Email links
- Number of unique users that have seen your posts
- Number of impressions of your content
- Number of interactions with your content
Similar to Facebook, Instagram also offers Audience Insights. Learn more about your audience demographics, such as age, location, gender, and times of day when your followers are most active.
Instagram Stories also offers analytics to track audience reach, impressions, and exits.
Last but not least, you can use IGTV analytics if you’re using the video part of the platform.
Twitter Analytics

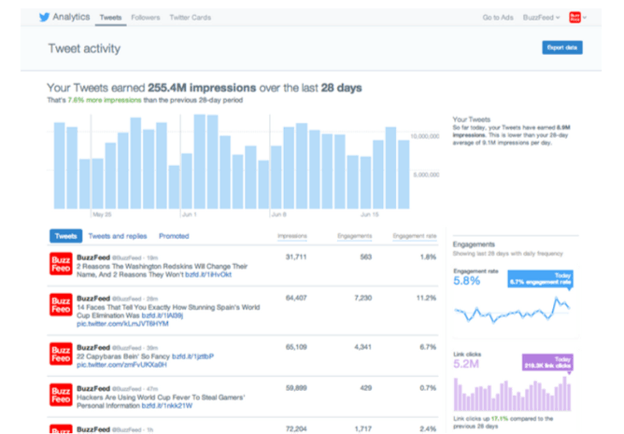
Twitter Analytics offers basic insight into your content’s performance, such as:
- Tweets with the most engagement
- Impressions over the last 28 days
- Profile visits
- Follower growth
- Ad campaign performance and conversion tracking
As with other social media analytics tools, you can use these details to drive your user-generated content program and inform your social publishing strategies to appeal to the right people.
LinkedIn Page Analytics

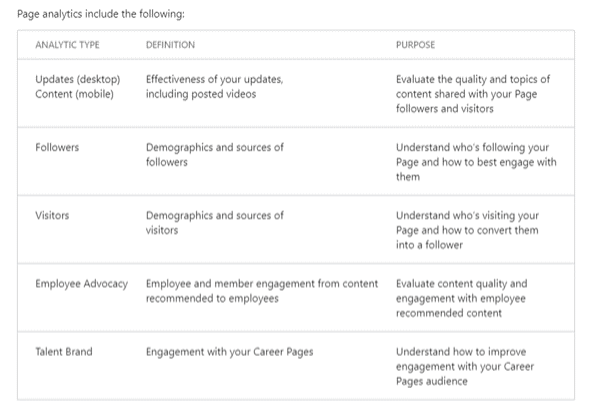
LinkedIn offers built-in analytics for business pages. Some of the metrics it collects include:
- Page visits
- Number of followers
- Engagement metrics such as clicks, comments, and shares
One of the more unique aspects of LinkedIn analytics is the content suggestions. The platform will recommend types of content to create to increase engagement. This can be very useful information to publish in a social media marketing report.
Note: The metrics you focus on in your report may vary based on the objective of the report. For example, a social listening report can help you determine how your content, brand, and campaigns are being perceived online, which is very different than a social media report analyzing your content's performance.
How to Use a Template for Your Social Media Reporting (with Sample Template Included)
Many marketers choose to create separate reports for each of their social networks. This allows you to separate your social media metrics by platform so you can judge each one’s performance individually.
Once you have your data, it’s time to put it together into a clean, usable format and share it with the right people.
Here’s a helpful format you can follow that captures all the details in a logical flow:
Report Summary
The report summary is a great place to discuss your social media goals, the overarching strategy, and what you’ve accomplished during this reporting period. Give a brief synopsis of the campaign or the reasons why the report matters.
Key Insights and Takeaways
This section should summarize the biggest takeaways from the report. Talk about any wins, accomplishments, or growth. Dive into specific reasons about the “why” behind the data. For example, if your campaign didn’t perform as well as your last one, you might mention that you lowered your budget or didn’t run the campaign for as long.
Visual Support
People don’t want to read an entire report, especially when a picture is worth a thousand words. Whenever possible, including charts, graphs, or other visuals to help you tell your story. Take screenshots of your analytics dashboards to make your report more compelling.
Opportunities
Your report is packed with great information. But what can the reader do with it?
Try to include some actionable takeaways from the report. Talk about ways you might improve your efforts in future campaigns. For example, if you notice that engagement on Instagram has really taken off, you might consider allocating more resources to advertising on Instagram next time.
Download Our Social Media Reporting Template
To help you get started with your social media reporting, we developed this simple template that captures essential metrics. Download the free template.
To truly take your reporting to the next level you may want to consider using a social media management platform that can automate your reporting. With templated dashboards, as well as customizable dashboards, that can be shared via email or downloaded, a solution like Meltwater can eliminate the work of manual reporting -- giving your more time back in your day to optimize your social media strategy. Get in touch through the form below to view the social media reporting templates and analytics available through the Meltwater platform.