

“Are our marketing efforts working?” This is a question that every team should be able to answer by taking a quick glance at a marketing report, but many marketing departments struggle to define their key performance indicators or establish the proper analytics tracking.
Regardless of whether or not you are reporting on bounce rates, lead generation or conversation rates, it's becoming increasingly important for marketing teams to track how their efforts generate revenue. Historically, revenue has not always been a metric that marketing teams were responsible for, but thanks to improved marketing analytics, this department is being tasked with helping driving growing the bottom line more and more.
And now that the C-suite is looking at your numbers more closely, it's crucial that you showcase the effectiveness of your activities with the hard numbers. Do you know how much you are you're getting back for every $1 you spend?
The good news is that the C-suite is investing in marketing departments and your peers have been able to create convincing reports. Gartner's CMO Spend Survey found that 61% of CMOs expected their marketing budgets to increase in 2020 and total marketing budgets are between 8 and 16% of total revenue.
If you're ready to measure your ROI, let's get started. By the end of this blog, you’ll know everything you need to know about marketing reporting, what KPIs to focus on, and will be able to answer the following questions:
What Is Marketing Reporting?
What Are the Benefits of Marketing Reporting?
What Should a Marketing Report Include?
How to Create a Marketing Report
How Often Should You Report?
Marketing Reporting Tools & Software
How to Build a Marketing Dashboard
Marketing Reporting Examples & Best Practices
Marketing Report Templates
Marketing Reporting Templates
What Is Marketing Reporting?
A marketing report is a collection of data from different marketing sources that helps make sense of the results of your efforts. Marketing reports show the data, good or bad, to help you draw important conclusions that can inform your marketing strategy.
Marketing reports include information like:
- Your marketing KPIs or goals
- Market research on current and potential customers
- Ad and email click-through-rate, open rates, etc.
- Numbers on how your performance compares to other brands and competitors
- Social media engagement rates, follower growth, impressions
These numbers help justify your efforts and highlight the success of your work. All in all, a report gives you the information you need to make more strategic decisions around your strategy.
What Are the Benefits of Marketing Reporting?
Before we get into the details of a marketing report, let’s take a look at all the benefits a marketing report can provide.
Let’s start with the honest truth: not everyone thinks marketing is worth the investment. In the past, marketing was viewed as a support function or a cost center, and this is where your marketing report can help disprove this old-school way of thinking. The first benefit of reporting is that it helps you communicate to people across your organization how you are driving traffic to the website, creating leads for sales, increasing your company's share of voice, and most importantly generating revenue.
Another benefit to reporting is that it consolidates all the information you need to check your performance in one place. You're busy, and don't necessarily have the time to pull up Google Analytics and Marketo every time you want to see how you're team is doing. By bringing all of your marketing analytics into a dashboard or report, you get an easily digestible snapshot of your performance.
Finally, I'll just state the obvious: reporting keeps you on track. If you are not tracking your marketing metrics how do you know whether you are on track to hit your goals? Marketing analytics provide you and your team with actionable insights into the conversion rates of your landing pages, your SEO traffic, your website's bounce rate, etc. These numbers and analytics can be used to refine your marketing strategy for the better.
What Should a Marketing Report Include?
What you include in your report will depend on the type of report you are interested in creating. For example, if you are looking to build a digital marketing report, then you may focus on tracking the conversion rates of your email marketing strategy or the cost-effectiveness of your LinkedIn ads.
These would be two different types of reports and would include different performance indicators. So before you begin building a report, ask yourself the following questions:
- What am I trying to show? Figuring this out will help you identify the area of focus.
- Who is this report for? Knowing this will help you identify the type of metrics you need to include.
- What type of data do I need? This allows you to understand what marketing tools you need to pull data from.
- How will this report be presented? The way your report will be viewed could impact the format
- How often is this report needed? Again, this could influence the format and style of the report.
How to Create a Marketing Report
Now that you have an understanding of the benefits of a marketing report and what one is, you're probably interested in beginning to create your own. Well, here are a few steps to help get you started.
1. Determine the purpose of the report
Ask yourself, what are you trying to accomplish with this report? Are you showing the success of your marketing campaign or justifying your budget? Maybe you’re trying to expand your headcount?
As a digital marketer myself, I have monthly social media reports that I use to track whether or not we're hitting our marketing KPIs. For example, growth in engagement, awareness, and follower count are just a few of the metrics we have set. The purpose of our report is to demonstrate our audience's engagement with our content.
2. Define your marketing goals
A goal is a specific, measurable, and time-bound metric that drives every marketing effort. Marketers who set goals are more likely to achieve them, according to CoSchedule,
“Marketers who set goals are 376% more likely to report success than those who don’t. And 70% of those successful, goal-setting marketers achieve them.”
Using the SMART model, you can easily define what your marketing goals are. SMART stands for specific, measurable, aspirational, realistic, and time-bound.
- Specific: Your goal must focus on one clearly defined metric.
- Measurable: You must have a way to measure the content you publish against that metric.
- Aspirational: Your goal must push you beyond the current results.
- Realistic: In the same breath, keep your aspiration in check with what you can reasonably complete with the resources that are (or will be) available to you.
- Time-bound: Your goal must have an end date upon which you will achieve that metric.
Here are some examples of marketing goals:
- Increase website traffic
- Gain more social media followers
- Grow your email subscribers
- Improve conversion rates
- Generate website or social media engagement
- Drive more click-throughs on paid ads
3. Identify the correct marketing metrics or KPIs
Marketing KPIs are used by the marketing team to track progress towards a specific goal. These metrics will help you determine the effectiveness of marketing campaigns. It's essential that you choose KPIs that are measurable, trackable and relevant. Here is a list of potential metrics that you may want to include in your marketing report:
- Number of contacts acquired
- Number of marketing qualified leads (MQLs)
- Number of sales accepted leads (SALs)
- Website traffic
- Website bounce rate
- Time on site
- Social media follower count
- Social media follower growth
- Avg. post engagement rate
- Avg. post reach
- Paid advertising spend
- Avg. cost-per-click
- Customer acquisition cost (CAC)
- Return on investment (ROI)
- Net Promoter Score (NPS)
Marketing KPIs are essential to your marketing strategy because they help determine the success of your strategies and improve. Not sure which ones to choose for your company? Check out this list we put together.
How Often Should You Report?
The answer to this question is all relative to the stakeholders you are reporting to, as different stakeholders want to see different things. For example, your coworkers will want to know the logistics of a PPC campaign on a daily basis, whereas upper management will want a weekly or monthly high-level overview.
Some marketing reports are delivered weekly, monthly, quarterly, or annually. Here are some good practices for different types of reports:
- Weekly/Daily reports: these reports are most likely internal reports. Meaning the information you share with your peers. These reports include data from PPC campaigns and social metrics.
- Monthly/Quarterly reports: These reports are a high-level overview of your weekly/daily reports, but also go in-depth. Your C suite wants to get a general idea if you are meeting your KPIs and is there to support filling the gaps.
- Annually reports: you should report annually on KPIs that you set at the beginning of the year. Everyone on the team will want to understand the story of the data over the course of the year.
Marketing Reporting Tools & Software
When it comes to reporting on your marketing efforts, every marketer will have a different answer as to what the best marketing tools are. The tool you choose will not only depend on your needs but also your budget. Remember, you need to prove your ROI and it doesn’t have to be scary.
To help you identify the correct tool for your team's needs, we've put together this list of the top marketing tools and the benefits of those tools.
And if you have daily weekly or monthly reporting needs, check out Meltwater's reporting for PR, social and marketing professionals. We provide a variety of pre-existing reporting templates as well as customizable dashboards. Our media and social listening solutions employ the use of artificial intelligence to provide you with a complete picture of your performance.
How to Build a Marketing Dashboard
Whatever tool you decide to use to track your data, you will need to build a marketing reporting dashboard. You need the dashboard to see the metrics that matter most to you (aka the KPIs that you set at the beginning). The dashboard is important because it structures and visualizes the data so marketers can easily understand what marketing efforts are successful and which aren’t. With dashboards, marketing reporting becomes faster and more accurate, allowing you to drive action.
When building the dashboard, you need to determine your objective, audience, and the main goal of the report. This will likely include several of the marketing metrics we outlined above.
Tip: Don’t include too many numbers in one report, as it can make it complicated to understand.
So how do you create a dashboard? Here are some helpful tips and examples to get you started:
- Center your dashboard around one topic
- Use the right chart to visualize your data
- Connect marketing KPIs with business impact
- Make your dashboards actionable
- Use a PR and Marketing Reporting tool
Here’s an example of an interactive dashboard from our Meltwater platform. Here we are looking at a social media monitoring dashboard - which you can see by the click of a button in Meltwater's social media monitoring tool -, displaying the sentiment, social reach vs. volume, a heat map of the channel's followers, and the top channels.
Each widget is populated with information from one or more of the following sources: news, social or RSS feed. Users can interact with and customize each widget individually, enabling the user to modify the date range and the search source for that widget.
Marketing Reporting Examples & Best Practices
Now that you know what a marketing report is, what KPIs to set, and what to include in your report, let’s take a look at some marketing reporting examples and best practices.
As we mentioned earlier when creating your marketing report you need to decide the purpose of your report, the audience, and frequency. And this can take some time to figure out. These best practices will help you work smarter.
- Schedule your reports: Schedule your reports ahead of time to consistently deliver the data your stakeholders are looking for.
- Obtain feedback from your audience: Ask questions to your stakeholders like, “How did this report help you?” or "What type of marketing channels do you want to be included?".
- Create report templates: Consider making a template to save time and ensure consistency across your reporting.
- Summarize the information at the top: Your stakeholders might not be able to read the full report, which is why it's helpful to have a summary at the beginning.
- Visualize the data as much as possible: Adding visuals to your data makes it easier to read and digest, and just looks better overall.
Marketing Report Templates
With lots of different reports available, it can be tough to find a starting point. Here are two examples two help you get started on the right track.
Meltwater's Digital Marketing Reports (DMI)
Meltwater’s Social Media Analytics help you understand how you are performing against your competitors. These automated reports provide you with insights into how the overall industry and individual competitors are performing across organic search rankings, paid spend, website traffic, and more.
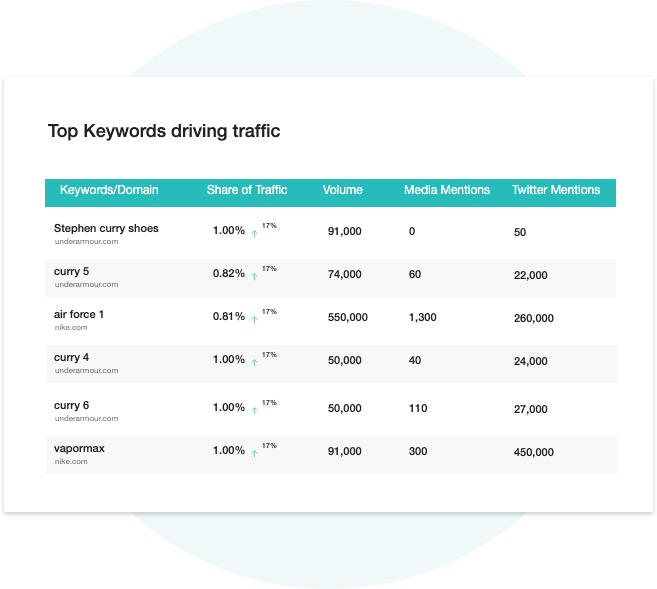
One of our favorite parts? Meltwater’s DMI reports break down where you and your competitors are being featured online, including which outlets provide the most traffic back to your website.

Meltwater's Social Insight Reports
Calling all social media managers! This report provides a comprehensive social media review of your brand, product and competition. It is used by teams to check the health of their brand, competitive benchmarking, inform product development and analyze customer experience.
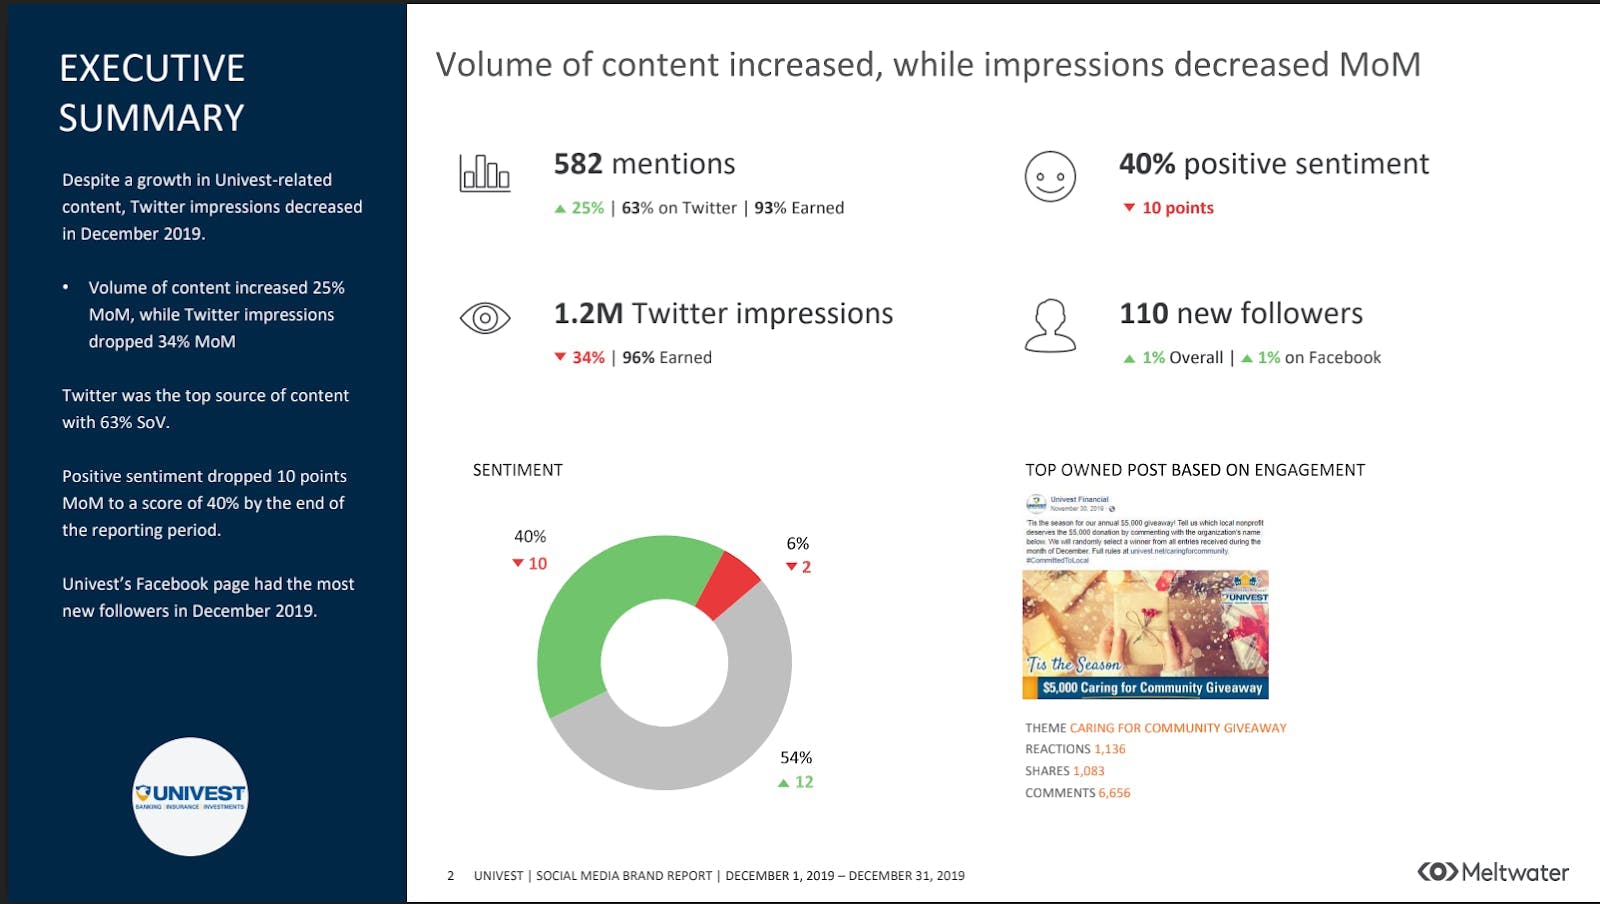
Our Social Insight Reports can be easily shared among peers with a few clicks. Plus, you are able to specify the branding, timing, and frequency of the reports. Here is an example of a social insight brand report. You will see the executive summary page, which highlights the important KPIs.

Marketing Reporting Templates
Now that you are a marketing reporting expert, put your knowledge to use. Here are three templates that are worthy to check out.
HubSpot
This template is a monthly marketing template designed to let you see the impact of strategic marketing initiatives and long-term projects, like SEO improvements, PR, and content marketing campaigns. The monthly report helps you understand how these projects influence the core metrics.

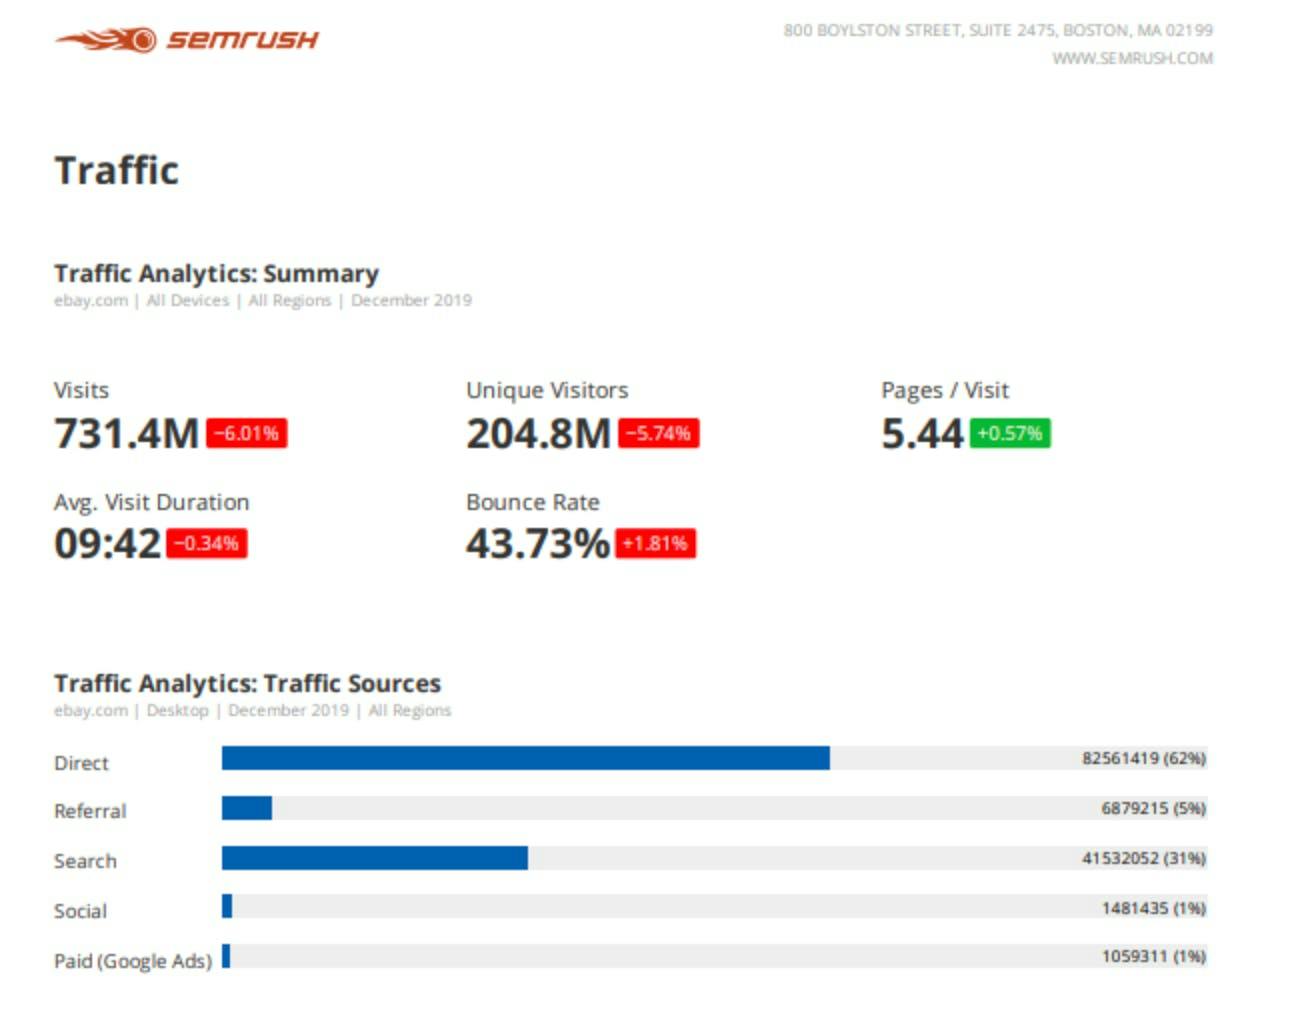
SEMrush
This is an SEO report template that can be used for a weekly or monthly basis. This report will help you (or your client) answer the following questions:
- How is my website traffic changing?
- What is the proportion of organic traffic changing compared to other traffic sources?
- Which countries do my visitors come from?
- What is the proportion of branded vs. non-branded traffic?

Supermetrics
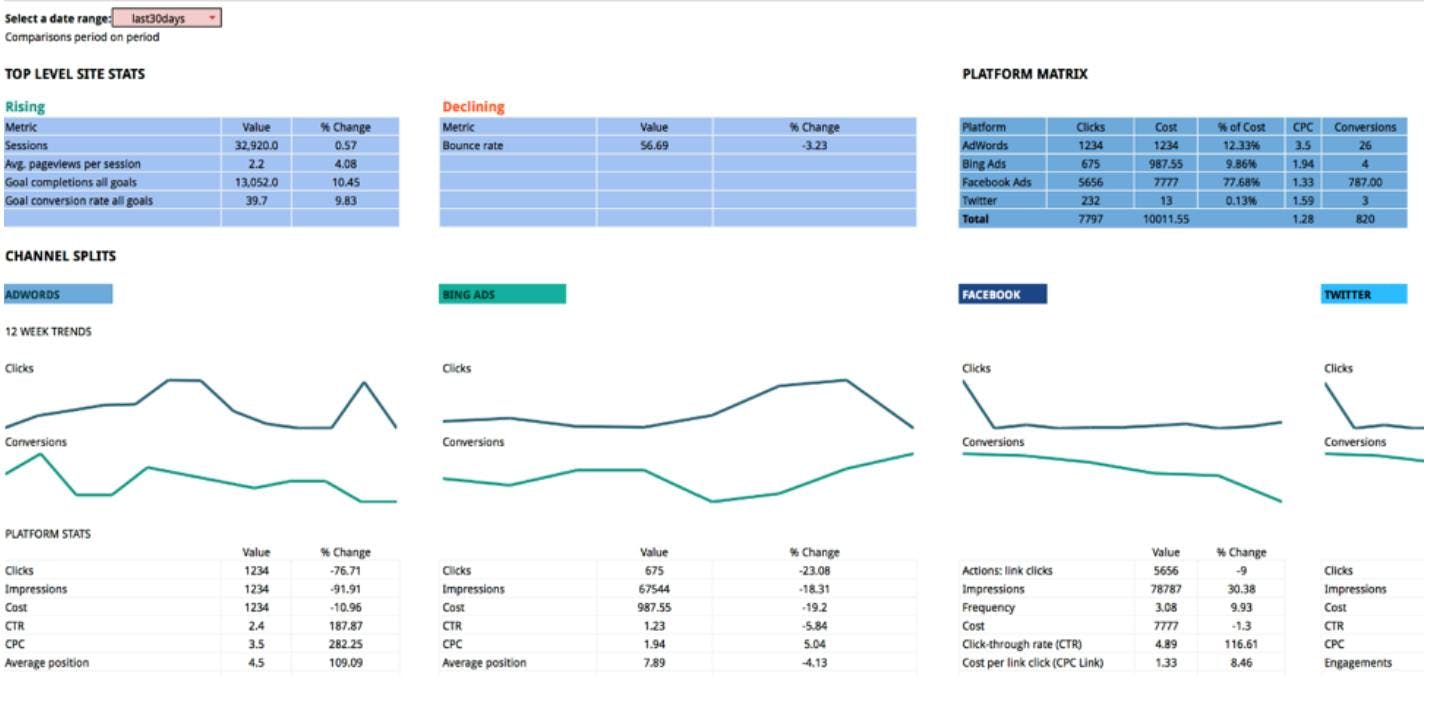
This paid channel mix template allows you to quickly see how your paid search efforts are performing across all your PPC channels – Facebook Ads, Twitter Ads, Bing Ads and Google Ads – in a single place.

Hopefully, now you and your team of marketing executives have a better understanding of which KPIs to focus on, as well as the type of reports best used to showcase them. Ready to put the pieces together and build your marketing report? Check out our Marketer’s Guide to Reporting for the full scoop. Happy reporting!